
After doing fuzzing, we concentrate on result analysis.
Check Fuzzer Status
afl-whatsup
It helps showing the running status and overall running overview of each fuzzer, where the data is the sum of all fuzzers.
Plus the -s option to display only the overview.
Use:
1 | $ afl-whatsup -s syncdir |
To see: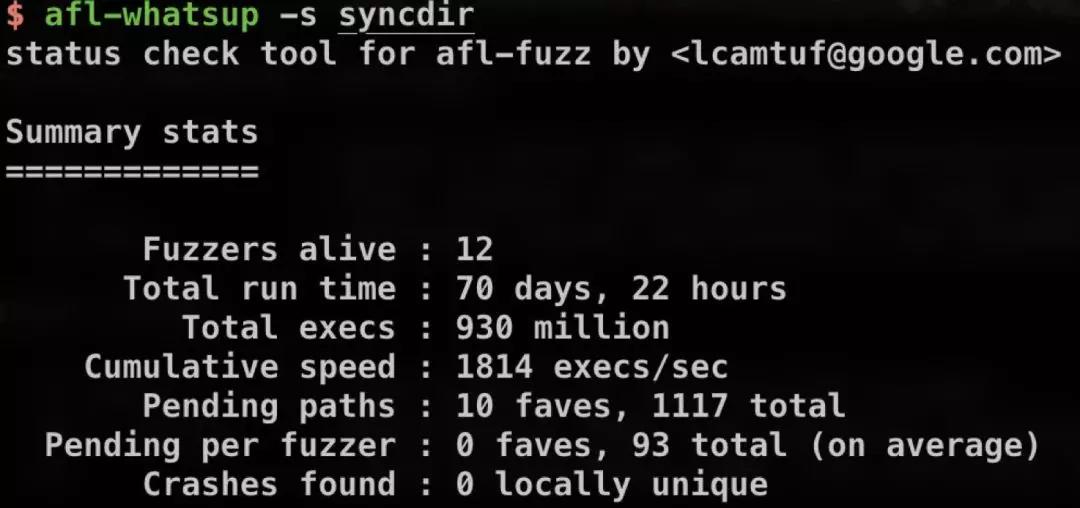
It’s real time status without auto refreshing.
People always give it a loop to have updating feedback.
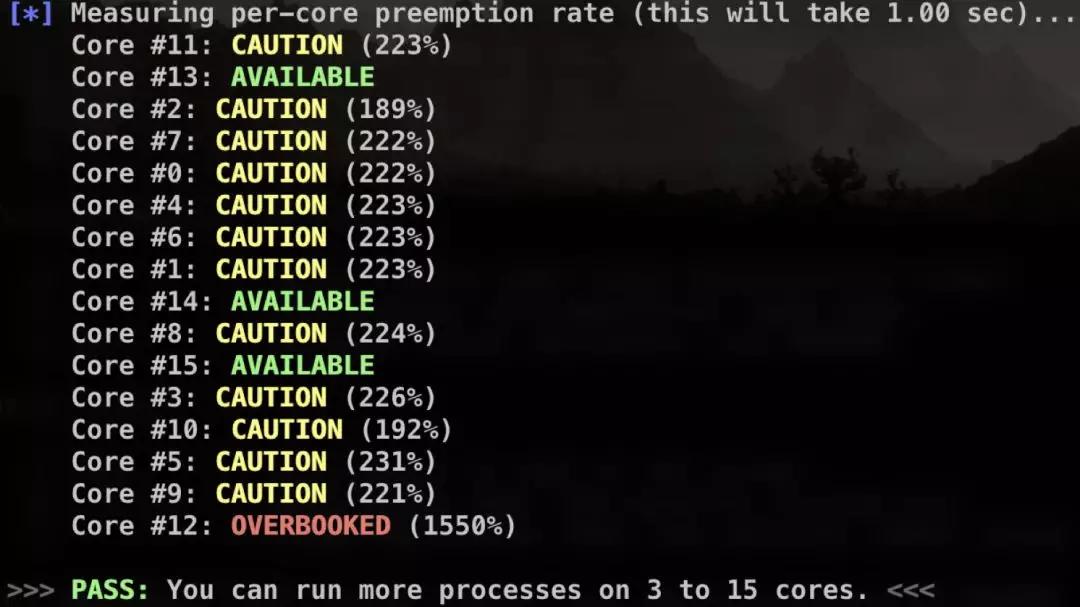
afl-gotcpu
It helps checking status of every core.
afl-stat
It is one of afl-utils, the AFL auxiliary tools .This tool is similar to the output of afl-whatsup.
Before using it, you need a configuration file to set the output directory of each afl-fuzz instance:
1 | # set file name as afl-stats.conf |
Then specify the configuration file to run:
1 | $ afl-stats -c afl-stats.conf |
afl-plot
Besides command line utils, we have afl-plot to produce (plot) more intuitive results.
1 | # install dependency -- gnuplot |
Click index.html to see graphs.
When to Stop
Normally you should wait as long as you can, until fuzzer get 100% coverage, but it’s hard to judge.
Look at upper right corner of AFL running panel, you see overall results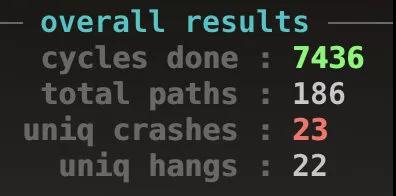
With cycles num increasing, it’s color turns from red to yellow, bule and eventually green.
Green means useless to do further fuzzing.
There’re some AFL extensions like pythia.
It shows status and give estimates of crash and path.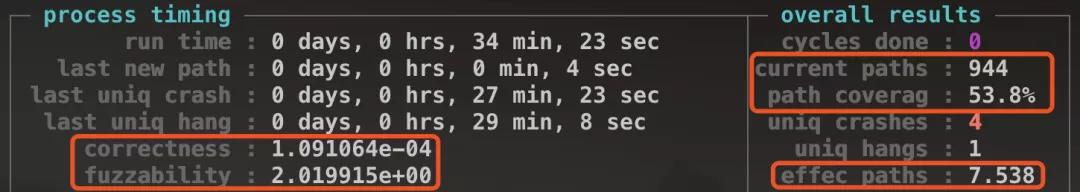
- correctness: probability of finding a crash leading input.
- fuzzability: difficulty of finding a new path. The higher, the easier to fuzz.
- current paths: the number of paths.
currently found. - path coverag: path coverage.
Once you have waited for several days,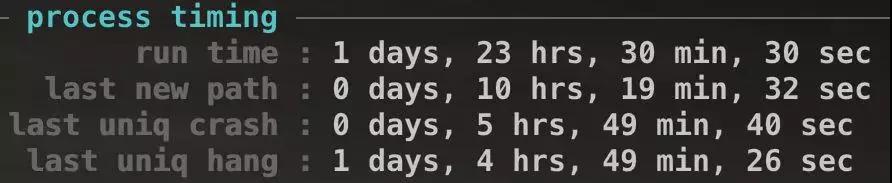
or the path coverage reaches 99%, or correctness decreases to 1e-08, stop the fuzz.
Output Result
Contents of multi-fuzzer instance sync dirs
1 | $ tree -L 3 |
- queue: stores all testcases with special executive paths.
- crashes: stores cases causing target to receive fatal signal and crash.
- crashes/README.txt: saves command parameters to execute crash cases.
- hangs: cases leading to target timeout.
- fuzzer_stats: afl-fuzz status.
- plot_data: for afl-plot to plot.
Process Result
Crash Exploration Mode
Also called peruvian rabbit mode, making sure the bug is exploitable.
Use -C parameter to turn on crash exploration mode, one crash case as input, afl-fuzz will produce related but different crashes.
1 | $ afl-fuzz -m none -C -i poc -o peruvian-were-rabbit_out -- /path/to/target @@ |
In this way, length of memory address can be messured, and buffer may be detected.
triage_crashes
This is a script in AFL source code dir :afl-2.52b/experimental/crash_triage/triage_crashes.sh
which helps trigger collected crashes.
1 | $ ./triage_crashes.sh /path/to/afl_output_dir /path/to/tested_binary [...target params...] |
Different SIGNAL means different signals.
For example, 11 means SIGSEGV (indicates buffer overflow), 06 means SIGABRT (indicates double free) …
Linux signal list
signal(7) man page
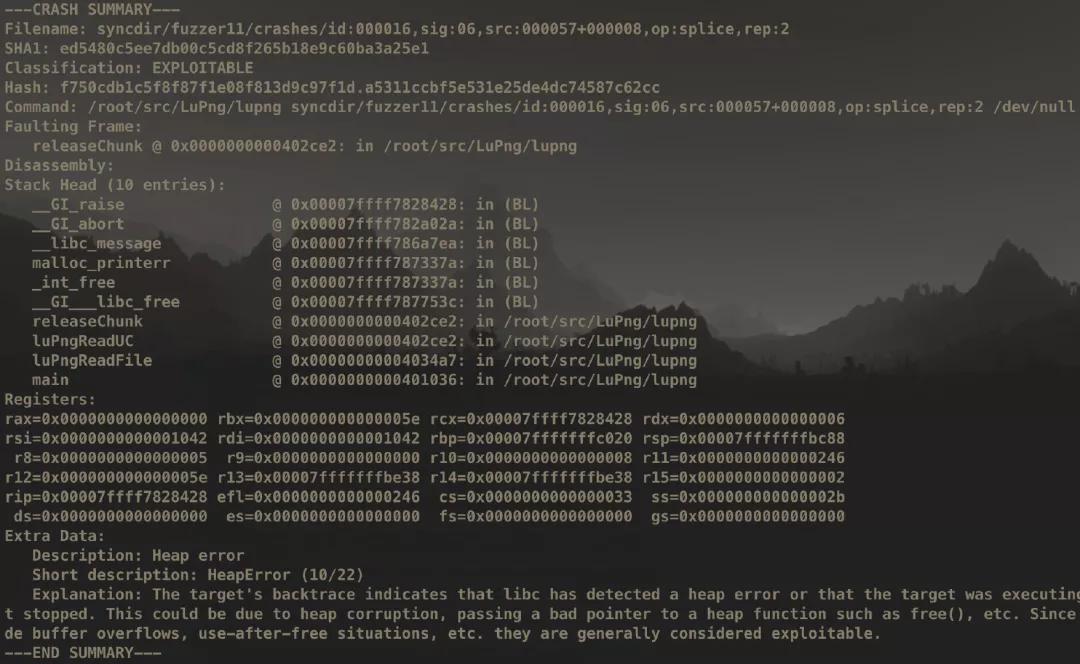
crashwalk
crashwalk gets you more detailed crashes classification results, and the specific causes of crashes.
It is based on exploitable plugin of gdb, install on ubuntu:
1 | $ apt install gdb golang |
Follow the lead, use correct path. You will find three binary files in $GOPATH.
crashwalk has Manual Mode and AFL Mode.Manual Mode reads crashes/README.txt to get command.AFL Mode set parameters manually.
1 | #Manual Mode |
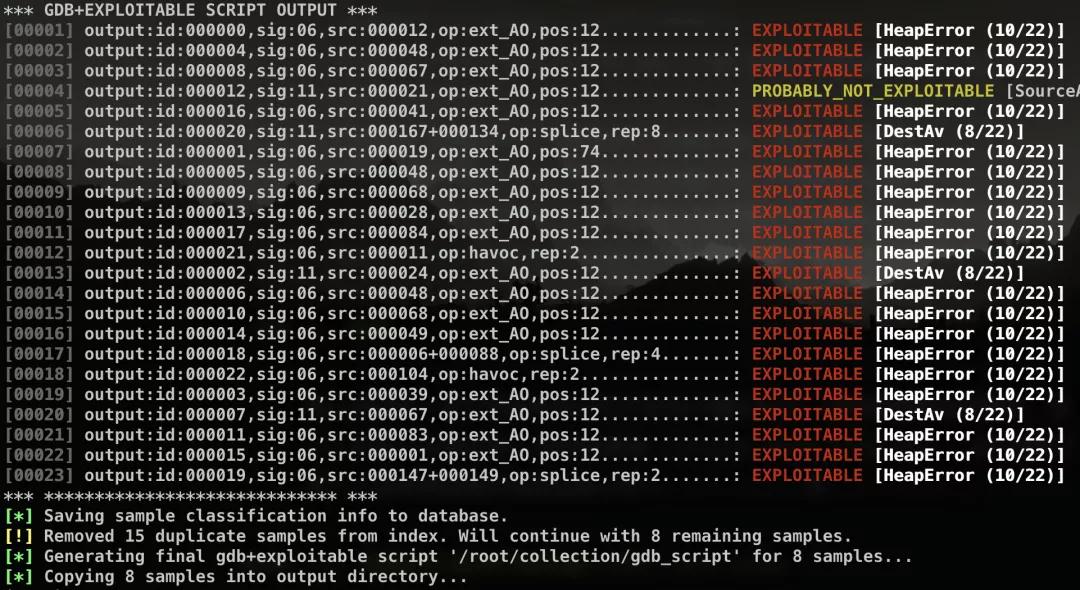
afl-collect
One of afl-utils suite, also based on exploitable plugin to check availability of crash.
It also delete useless or duplicated crash sample
1 | usage: afl-collect [-d DATABASE] [-e|-g GDB_EXPL_SCRIPT_FILE] [-f LIST_FILENAME] |
Code Coverage
A method to measure coverage of program, like whether a line of source code has been executed, or whether an instruction in the assembly code has been executed.
There’re three levels of coverage detections: function, basic-block, edge.
Basic Block
A set of sequentially executed instructions.
Once the first instruction is executed, following instructions must be executed.
That means, one basic block contains only one entry and only on exit.
For example: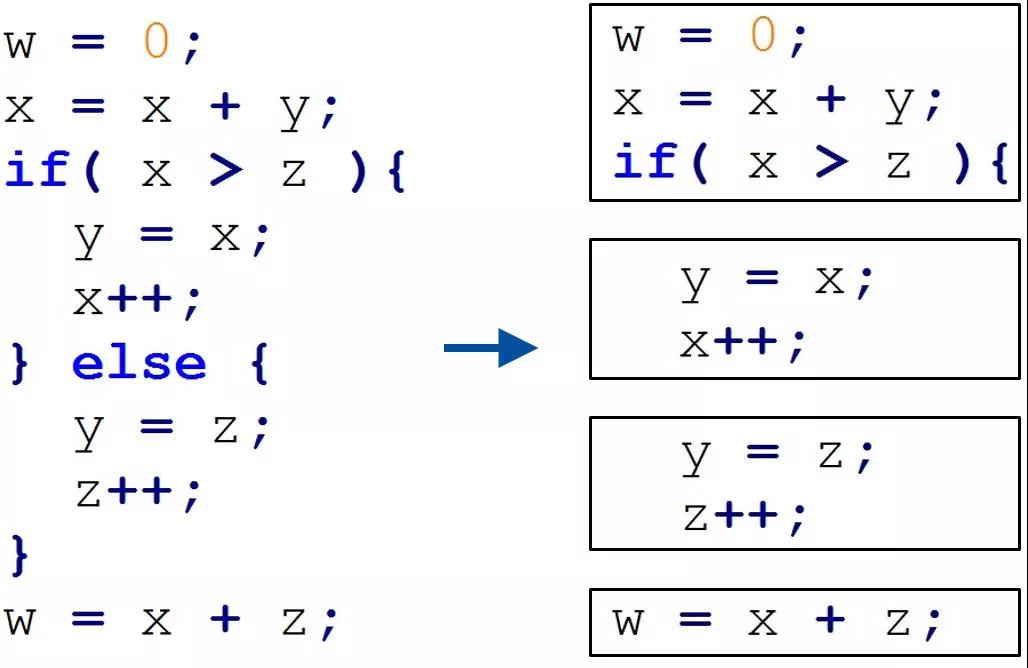
IDA can also divide it into four blocks: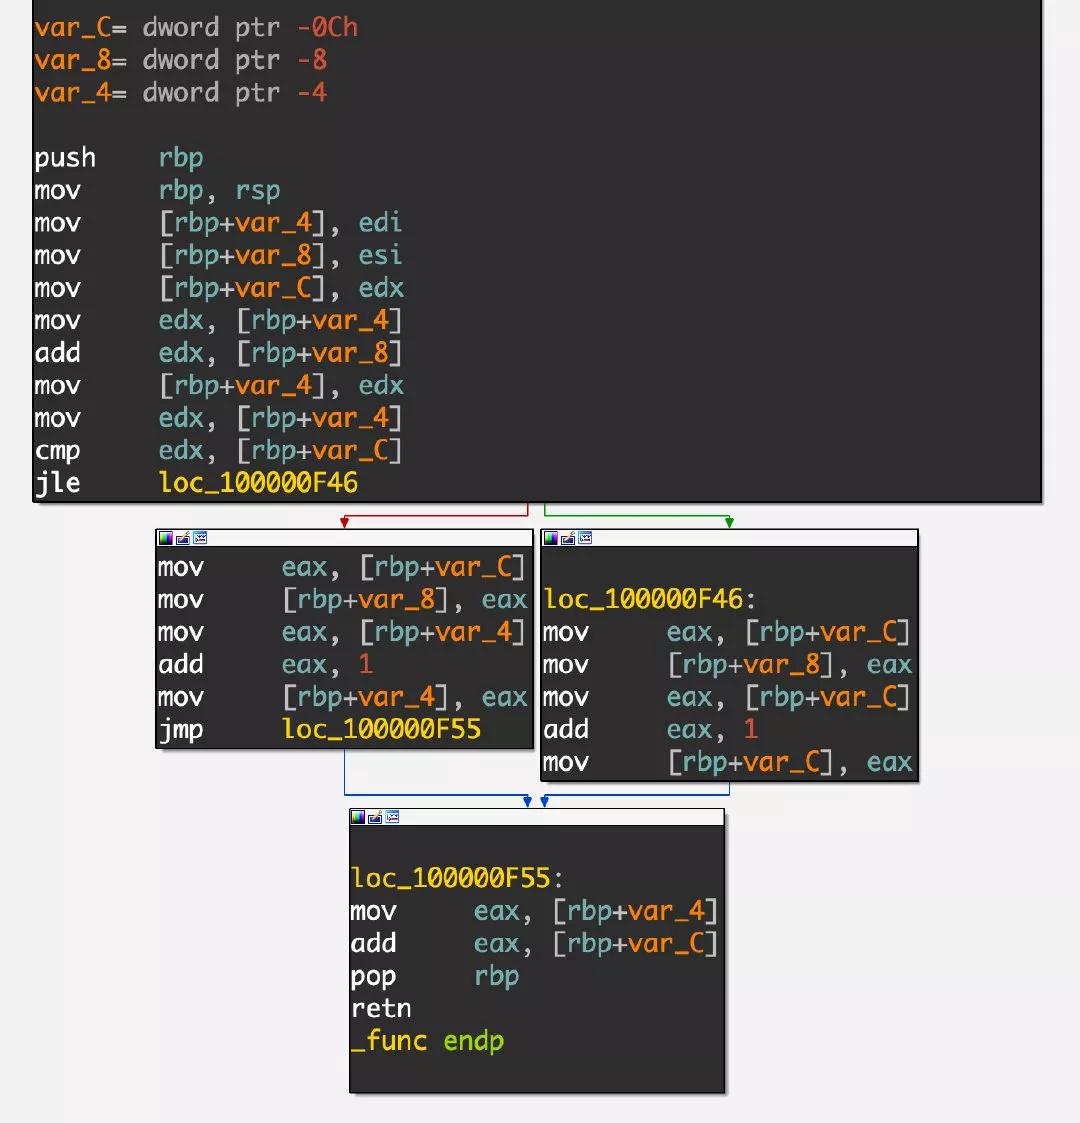
Edge
Edge is used to represent the jump between basic blocks.
Just like the lines between every blocks in IDA view.
Tuple
In the implementation of AFL, a tuple(branch_src, branch_dst) is used to record the information of the current basic block + the previous basic block, to obtain the target execution flow and code coverage.
Do Caculation
GCOV is released with gcc, with same principle of instrumentation by afl-gcc, it generates code coverage info after instrumented by gcc.
LCOV is another tool and also the graph front-end of GCOV.
afl-cov helps call two tools above to process result from afl-fuzz.
Installation
We mainly use afl-cov
1 | $ apt-get install afl-cov |
Rebuild
First use gcov to rebuild source.
Adding -fprofile-arcs and ftest-coverage to CFLAGS.
Better reassign new dir by --prefix so as not to cover files afl-gcc instrumented.
1 | $ make clean |
Calculate
Then we execute afl-cov.
1 | # example |
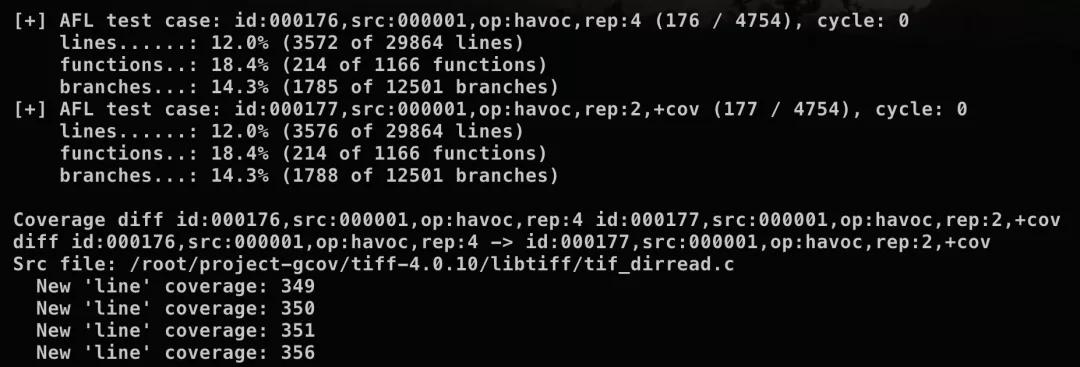
Finally we get a code coverage report in html.